
Fast Robots
ECE 4160 Spring 2023
ECE 4160 Spring 2023


Hi, I'm Allison, and I'm a junior at Cornell studying Mechanical Engineering.
This website documents the work I'm doing for ECE 4960.
Objective
The goal of Lab 1 is to set up and become familiar with the Arduino IDE and the Artemis board. Specifically, this involves
becoming comfortable programming the Artemis board, using the board LED, reading/writing serial messages over USB, and
using the onboard temperature sensor and Pulse Density Microphone.
Hardware
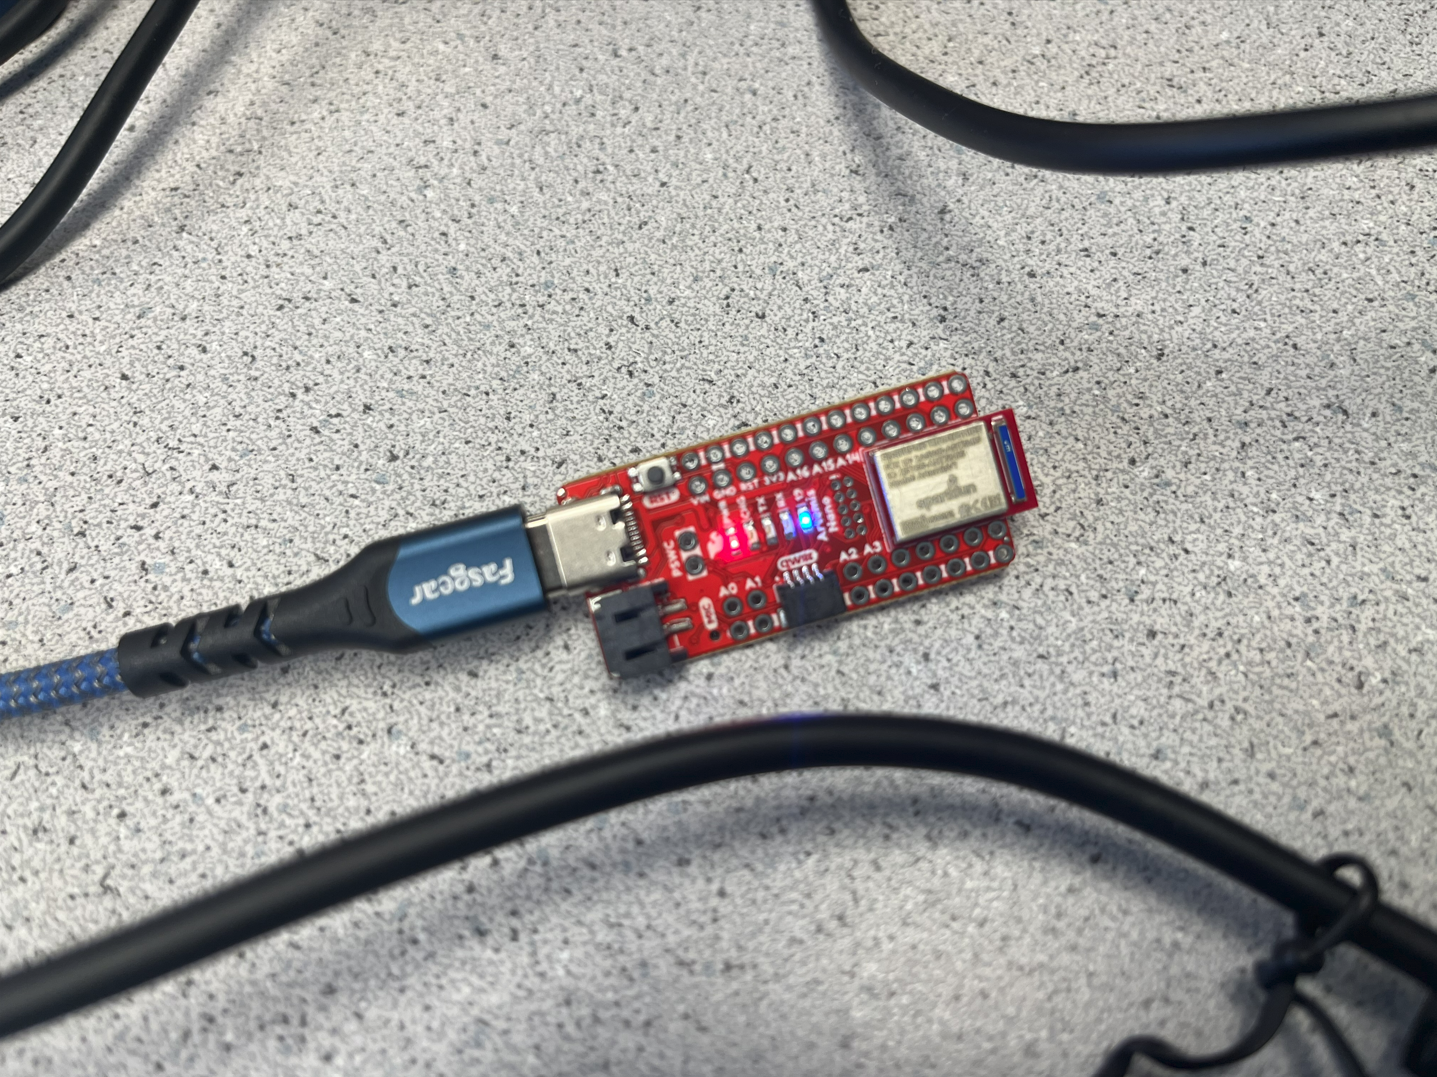
1 x SparkFun RedBoard Artemis Nano
1 x USB C-to-C Cable
Software
Arduino IDE
Example: Blink it Up
After hooking up the Artemis Board and following installation instructions for Arduino, I first ran the program “Example:
Blink it Up” to ensure that the LED on the Artemis Board was working properly. I also lowered the baud rate to 115200 bits/s
to get the example to work.
Example4_Serial
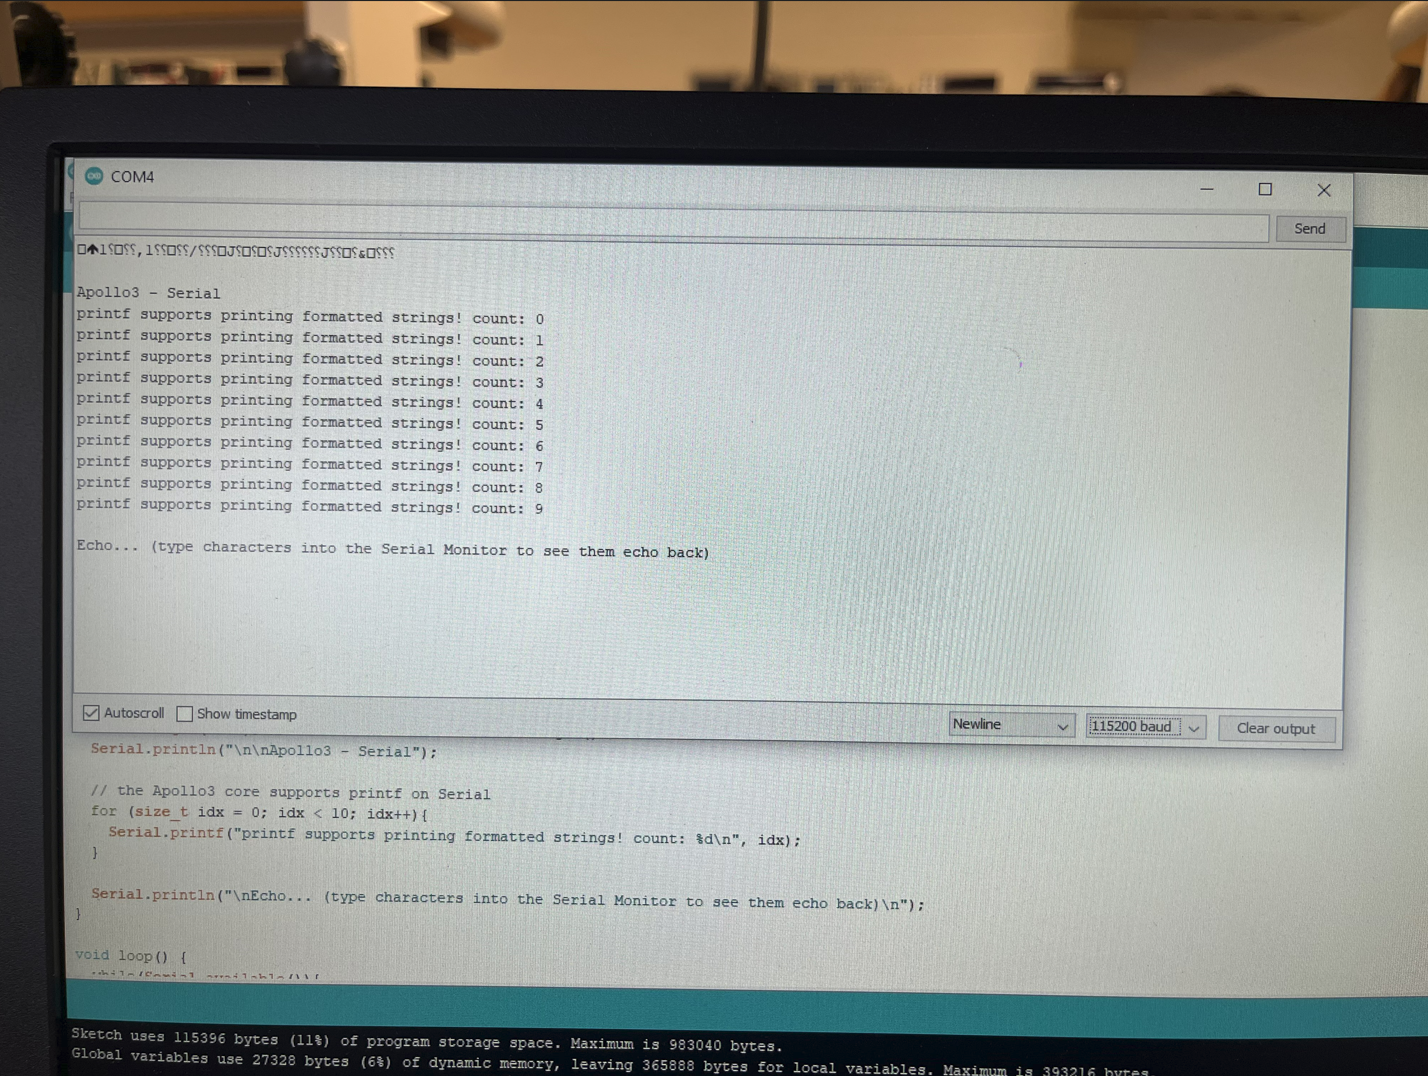
I uploaded code from File->Examples->Artemis Examples->Example4_Serial to test the serial communication between the Artemis
board and the computer, which was shown in the serial monitor. It also allowed the user to provide an input, which would then
be echoed back as the output.
Example2_AnalogRead
To test the temperature sensor, I uploaded code from “File->Examples->Artemis Examples->Example2_analogRead”. In the video,
whenever my thumb wasn’t on the chip, the temperature values were in the 4000s range. Whenever my thumb pressed on the chip,
the readings shot up into the 20000s range.
Example1_MicrophoneOutput
To test the microphone, I uploaded code from “File->Examples->PDM->Example1_MicrophoneOutput”. From there, I used an online note
generator to play the note A4, which has the frequency of 440 Hz. The serial monitor printed out that the microphone detected a
frequency of 434 Hz, which is very close to 440 Hz.
Objective
The objective of Lab 2 is to establish communication between the Artemis board and the computer. Using the Arduino programming language on the Artemis and Python code in a Jupyter notebook, this framework is used to send data using Bluetooth, which will be useful for future labs.
Hardware
1 x SparkFun RedBoard Artemis Nano
1 x USB C-to-C Cable
1 x Bluetooth Adapter
(The intention was to use the provided Bluetooth adapter. However, after experiencing multiple issues with
the Bluetooth adapter disconnecting without warning, I decided to use the Intel(R) Wireless Bluetooth(R) on my laptop.)
Software
ArduinoBLE
Codebase
JupyterLab
1. Prelab
Setup
The computer setup involved creating a new virtual environment in JupyterLab called FastRobots_ble, installing the necessary Python
Packages, and downloading the provided Lab 2 Codebase. However, prelab was complicated by the Bluetooth software’s incompatibility
with Windows 11, making it difficult to get the system set up. Thanks to the help of course TAs and fellow students who found a solution,
JupyterLab is set up on Windows 11 using Windows Subsystem for Linux (WSL). Below is a screenshot of the MAC address printing:
Codebase
The codebase consists of subfolders named ble_arduino and ble_python. ble_arduino includes ble_arduino.ino, which has the Arduino code
for the Artemis, and necessary class definitions. ble_python contains Python files, including demo.ipynb and connection.yaml. All of
these files are essential for Bluetooth to work between the computer and the Artemis.
2. Lab Tasks:
The implementation of the following tasks ensured that it was possible to receive time stamped messages from the Artemis:
Configurations
After setup was completed, the following configurations were made so that the devices could establish a connection. First, the Artemis
MAC address was updated to be one used by the Artemis in the prelab. Afterwards, the BLEService UUID was changed to avoid accidentally
connecting my classmates. This was achieved by generating a new UUID and putting it on the “#define BLE_UUID_TEST_SERVICE” line in
ble.arduino.ino, as well as the “ble_service” line in connections.yaml.

demo.ipynb
Before carrying out the lab tasks, I made sure that I was able to run all the cells:


Commands
The implementation of the following tasks ensured that it was possible to receive time stamped messages from the Artemis:
ECHO Command
Sending an ECHO command with a string value to the Artemis will return the string value with an appended “:))” to the computer.

GET_TIME_MILLIS Command
When sent, the command GET_TIME_MILLIS will result in the robot reply with the current time on the string characteristic. This was
accomplished using the Arduino function millis().

Notification Handler
A notification handler was set up in Python so that strings from the Artemis can be received automatically. This will be useful
since now multiple string arrays can be gathered without being called manually.

GET_TEMP_5s Command
Sending the GET_TEMP_5s command will send an string array of five timestamped internal temperature readings in the span of five seconds,
with readings sent once per second. With the characteristic size limit in mind, one time-temperature pair was sent at a time.

GET_TEMP_5s_RAPID Command
The GET_TEMP_5s_RAPID command works similarly like the GET_TEMP_5s, except this command sends a string array with five seconds
worth of data, meaning a lot more time-temperature pairs are. Like before, one time-temperature pair was sent at a time because
of the characteristic size limit.

Limitations
Real-time communication is not practical because working with strings results in significant latency. Instead, the robot must be
able to handle all real-time processing on-boarding and relay results in chunks. With this taken into consideration, let’s consider
the limitations of the Artemis, which has 384 kB (3,072,000 bits) of RAM. If we were to sample 16-bit values at 150 Hz every 5
seconds, that is 2400 bits per second or 12000 bits over that 5 second period. That means only 256 of these 5 second groups can be
sent before the Artemis runs out of storage.
Objective
The goal of this lab is to equip the robot with sensors, namely two Time of Flight (ToF) sensors, so that it can find its distance from an object.
It is important for the robot to sample at a fast rate because the faster the robot can sample, the more it can trust a sensor reading, and therefore
the faster it is able to drive.
Hardware
1 x SparkFun RedBoard Artemis Nano
1 x USB C-to-C Cable
2 x 4m ToF Sensors
1 x QWIIC Breakout Broad
2 x QWIIC Connector
1 x Ruler
Software
ArduinoBLE
Codebase
JupyterLab
1. Prelab
AAs found on the VL53L0X datasheet, the default address of the ToF sensor is 0x52.
Since two sensors will be used, the addresses of each ToF sensor will need to be changed in order to distinguish the data received from each one.
This can be accomplished in two ways:
1. Changing the address programmatically (while powered)
This method consists of changing the I2C address of one of the ToF sensors while the other one is shut down using the Xshut pin. That way, the
sensors will have different I2C addresses and the computer can tell apart the data sent by the two sensors. It will also allow both sensors to
be read without having to shut down one while the other is running.
2. Enable sensors separately through their shutdow pins
This alternative method involves pulling down the shutdown pin of one sensor to power it off every time the other one is extracting data using the
shared I2C address. This method conserves power by turning off one sensor when not in use, eliminating the need to change the sensor addresses after
each power cycle. However, implementing this method requires additional programming logic to control the activation and deactivation of the shutdown
pins, which can cause communication delays in the program.
After considering the placement of the two sensors, I decided to put one in the front and the other on the side to optimize the robot’s movement.
One should go in the front so that the robot knows where it is heading to. As for the second sensor, placing it on the side will be the most useful
choice for figuring out the positioning of the robot rather than placing it in the front or the back.
2. Connecting the ToF sensor to the QWIIC Breakout Board
Pictured is the ToF sensor connected to the QWIIC breakout board.
3. I2C Address
When running the Example05_Wire_I2C file with one ToF sensor connected, the serial monitor printed out 0x29 as the I2C address instead of 0x52 as
anticipated. A possible explanation for this is that 0x29 is equal to 0x52 bit-shifted to the right. The last bit is taken off since it is used
as a read/write bit, and therefore is not read in the address.
4. ToF Modes
According to the data sheet, the ToF sensor can work in three different modes. The short mode has a maximum distance of up to 1.3m and has better
ambient immunity. The medium mode has a maximum distance of up to 3m. The long distance, or the default, mode has a maximum distance of up to 4m,
which is the maximum distance of the sensor overall. After weighing the pros and cons of each mode, it was determined that the short mode would be
the best choice because it is not as sensitive to how bright the environment is compared to the other modes. However, if a longer range is needed,
the medium or long mode should be used, albeit in an environment that’s not too bright.
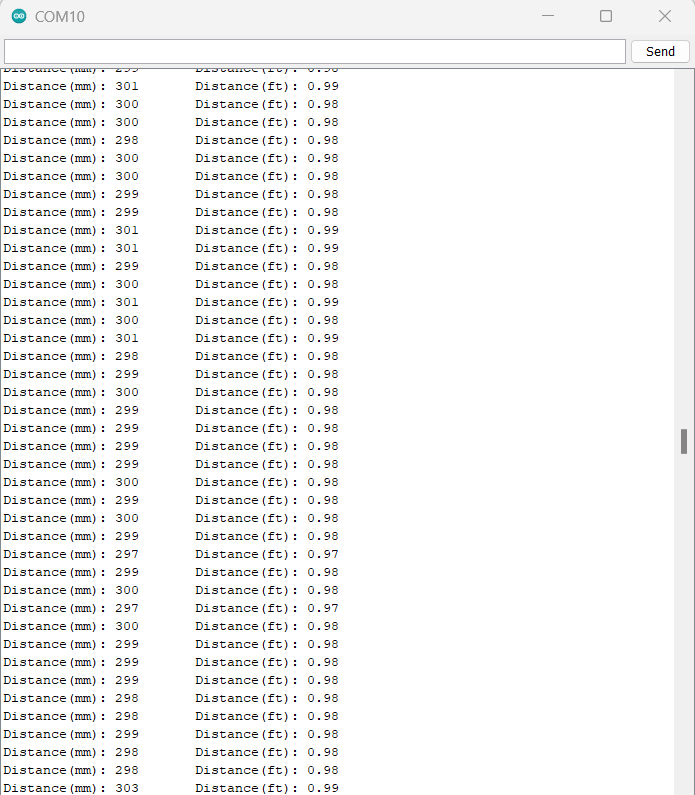
5. Sensor Data Collection
To test the ToF sensor range, accuracy, repeatability, and ranging time, the SparkFun Example1_ReadDistance example was used. To accomplish this,
ten measurements were taken every 0.1m from 0.1m to 1.2m. It was also found that the sensor range was approximately 1.900m.
Below for each distance are the average absolute difference in distance for assessing accuracy and the standard deviation for assessing repeatability.
The results were also plotted on a graph.
6. 2 ToF Sensors
As mentioned earlier, hooking up both ToF sensors simultaneously means changing the I2C address of one of them while the other is shut down using the Xshut
pin. This was accomplished with sensor 1’s xshut pin being pin 8 and sensor 2’s xshut pin being pin 7. Sensor 1 is shut down while sensor 2’s new I2C
address is changed to be 0x10 before sensor 1 is turned on and both are connected. The results were the sensors working in parallel
7. ToF Sensor Speed:
To print Artemis clock to the Serial as fast as possible, continuously, and only print the data from the sensors when available, the SparkFun Example1_ReadDistance
example program was modified to print the the current time, ranging time, and the distances from sensor 1 and sensor 2 respectively.
As shown, the ranging time is approximately 52 ms. This is the limiting factor in the sense that this is the minimum time between data points. In other words, this
is how long the sensor takes in between reading and sending data.
8. Time vs Distance
Work from Lab 2 is edited to record time-stamped ToF data for a set period of time and then sent to my laptop via Bluetooth.
Objective
The goal of Lab 1 is to set up and become familiar with the Arduino IDE and the Artemis board. Specifically, this involves
becoming comfortable programming the Artemis board, using the board LED, reading/writing serial messages over USB, and
using the onboard temperature sensor and Pulse Density Microphone.
Hardware
1 x SparkFun RedBoard Artemis Nano
1 x USB cable
1 x 9DOF IMU sensor
2 x 4m ToF sensor
1 x QWIIC Breakout board
2 x Qwiic connector
1 x JST2 connector+cable
1 x Force1 RC car
1 x Li-Ion 3.7V 850mAh battery)
Software
Arduino IDE
Example: Blink it Up
After hooking up the Artemis Board and following installation instructions for Arduino, I first ran the program “Example:
Blink it Up” to ensure that the LED on the Artemis Board was working properly. I also lowered the baud rate to 115200 bits/s
to get the example to work.
Example4_Serial
I uploaded code from File->Examples->Artemis Examples->Example4_Serial to test the serial communication between the Artemis
board and the computer, which was shown in the serial monitor. It also allowed the user to provide an input, which would then
be echoed back as the output.
Example2_AnalogRead
To test the temperature sensor, I uploaded code from “File->Examples->Artemis Examples->Example2_analogRead”. In the video,
whenever my thumb wasn’t on the chip, the temperature values were in the 4000s range. Whenever my thumb pressed on the chip,
the readings shot up into the 20000s range.
Example1_MicrophoneOutput
To test the microphone, I uploaded code from “File->Examples->PDM->Example1_MicrophoneOutput”. From there, I used an online note
generator to play the note A4, which has the frequency of 440 Hz. The serial monitor printed out that the microphone detected a
frequency of 434 Hz, which is very close to 440 Hz.
Objective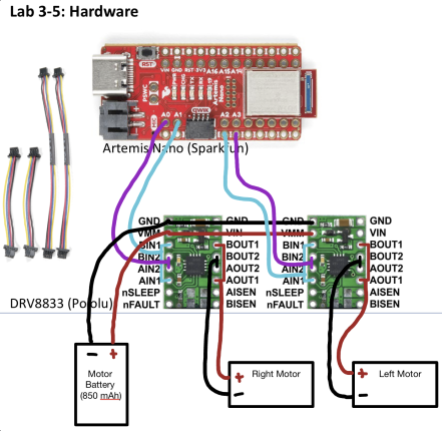

Objective
The goal of Lab 1 is to set up and become familiar with the Arduino IDE and the Artemis board. Specifically, this involves
becoming comfortable programming the Artemis board, using the board LED, reading/writing serial messages over USB, and
using the onboard temperature sensor and Pulse Density Microphone.
Hardware
1 x R/C stunt car
1 x SparkFun RedBoard Artemis Nano
1 x USB cable
2 x Li-Po 3.7V 650mAh (or more) battery
2 x Dual motor driver
2 x 4m ToF sensor
1 x 9DOF IMU sensor
1 x Qwiic connector
Software
Arduino IDE
Example: Blink it Up
After hooking up the Artemis Board and following installation instructions for Arduino, I first ran the program “Example:
Blink it Up” to ensure that the LED on the Artemis Board was working properly. I also lowered the baud rate to 115200 bits/s
to get the example to work.
Example4_Serial
I uploaded code from File->Examples->Artemis Examples->Example4_Serial to test the serial communication between the Artemis
board and the computer, which was shown in the serial monitor. It also allowed the user to provide an input, which would then
be echoed back as the output.
Example2_AnalogRead
To test the temperature sensor, I uploaded code from “File->Examples->Artemis Examples->Example2_analogRead”. In the video,
whenever my thumb wasn’t on the chip, the temperature values were in the 4000s range. Whenever my thumb pressed on the chip,
the readings shot up into the 20000s range.
Example1_MicrophoneOutput
To test the microphone, I uploaded code from “File->Examples->PDM->Example1_MicrophoneOutput”. From there, I used an online note
generator to play the note A4, which has the frequency of 440 Hz. The serial monitor printed out that the microphone detected a
frequency of 434 Hz, which is very close to 440 Hz.
Objective
The goal of Lab 1 is to set up and become familiar with the Arduino IDE and the Artemis board. Specifically, this involves
becoming comfortable programming the Artemis board, using the board LED, reading/writing serial messages over USB, and
using the onboard temperature sensor and Pulse Density Microphone.
Hardware
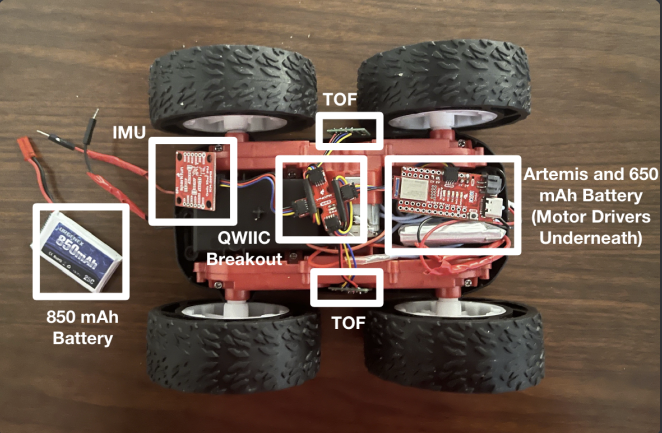
1 x Fully assembled robot, with Artemis, TOF sensors, and an IMU.
Software
Arduino IDE
Example: Blink it Up
After hooking up the Artemis Board and following installation instructions for Arduino, I first ran the program “Example:
Blink it Up” to ensure that the LED on the Artemis Board was working properly. I also lowered the baud rate to 115200 bits/s
to get the example to work.
Example4_Serial
I uploaded code from File->Examples->Artemis Examples->Example4_Serial to test the serial communication between the Artemis
board and the computer, which was shown in the serial monitor. It also allowed the user to provide an input, which would then
be echoed back as the output.
Example2_AnalogRead
To test the temperature sensor, I uploaded code from “File->Examples->Artemis Examples->Example2_analogRead”. In the video,
whenever my thumb wasn’t on the chip, the temperature values were in the 4000s range. Whenever my thumb pressed on the chip,
the readings shot up into the 20000s range.
Example1_MicrophoneOutput
To test the microphone, I uploaded code from “File->Examples->PDM->Example1_MicrophoneOutput”. From there, I used an online note
generator to play the note A4, which has the frequency of 440 Hz. The serial monitor printed out that the microphone detected a
frequency of 434 Hz, which is very close to 440 Hz.
Objective
The goal of this lab is to implement grid localization using Bayes filter. Simulating localization before implementation on the actual robot will help with testing functions in a more stable environment. All functions used in this lab are from Anya Prabowo’s 2022 Fast Robots website.
Software
Localization Software
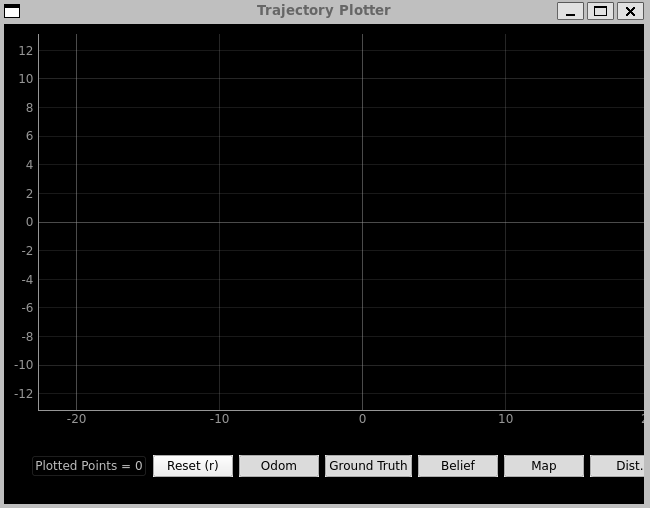
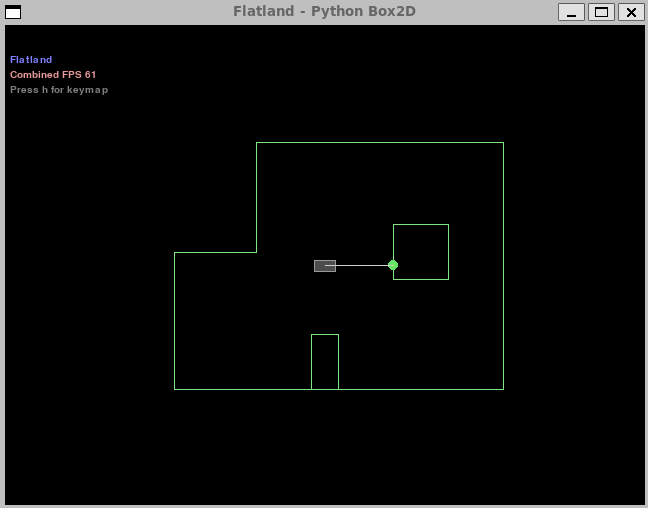
Simulation Setup
First, the simulation was set up. This is what the plots look like:
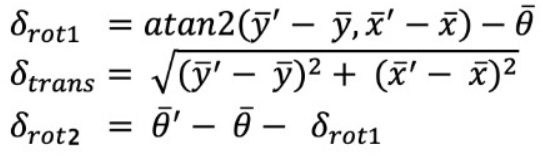
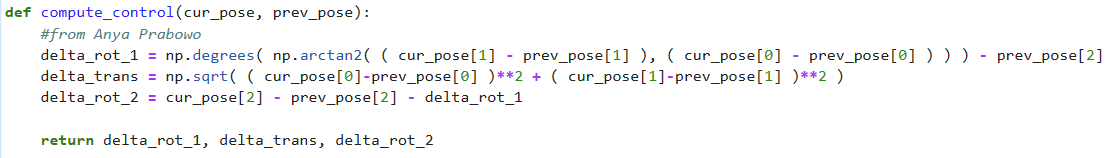
Compute Control
Proceeding with the implementations, first is Compute Control, which uses the current and previous position of the robot to
compute the following equations below:
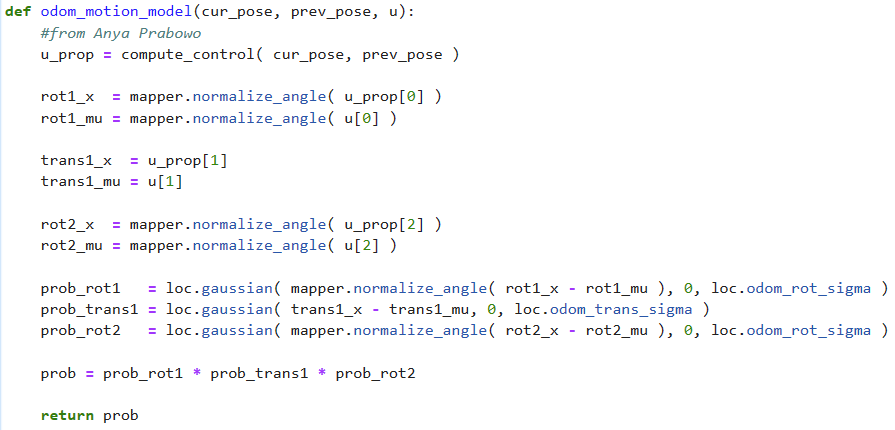
Odometry Motion Model
Next, the Odometry Motion Model utilizes the robot’s current position, its previous position, and the control information from
Compute Control to calculate the probability that the actual movement of the robot occurred using the gaussian distribution.
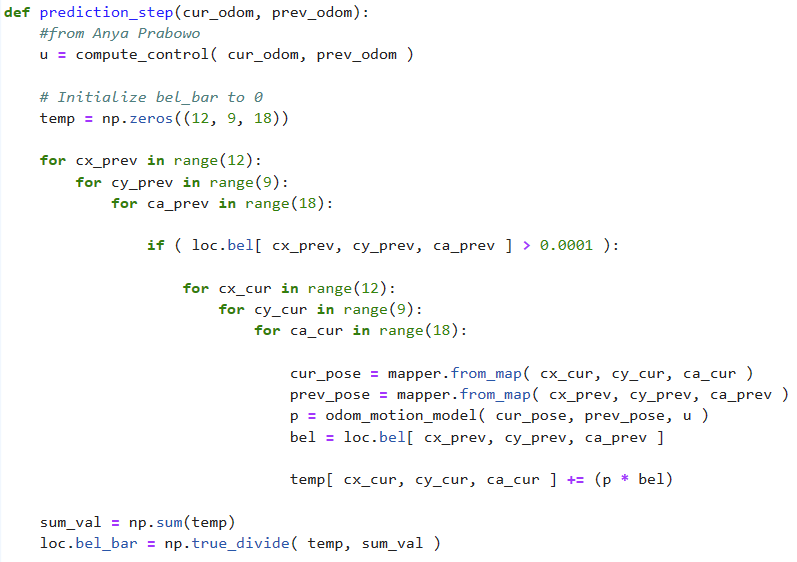
Prediction Step
The Prediction Step predicts the robot’s position by using the current and previous odometry readings to update the current
position.
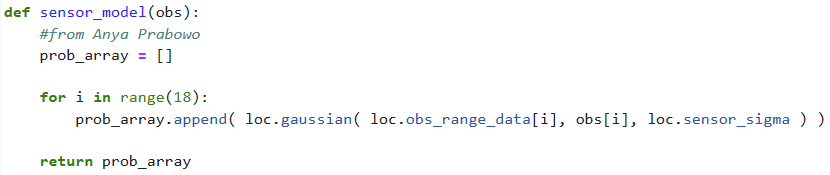
Sensor Model Update
The Sensor Model Update calculates that the probability of each sensor measurement the robot collected being correct given the
robot’s current position.
<
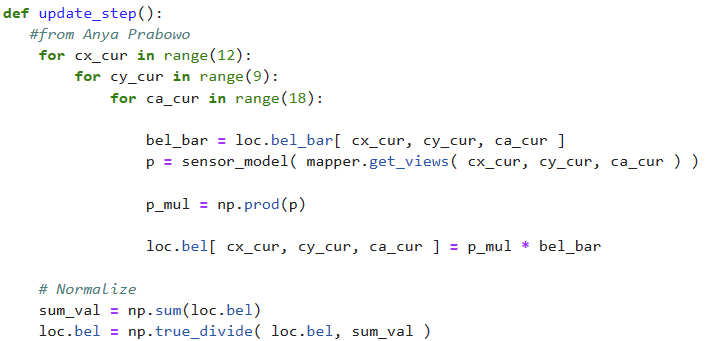
Update Step
Finally, the robot proceeds to the update step of Bayes Filter. Using all previous sensor measurements and controls, it calculates
the prior belief and the sensor model. It also calculates the product of the values in the sensor model probability array, which
is then multiplied by the prior belief and then normalized to create a valid probability distribution.
Demo
Below is a video showing the results
Objective
The goal of this lab is to perform localization with the Bayes filter on the actual robot and develop an appreciation for the
differences between simulation and the real-world
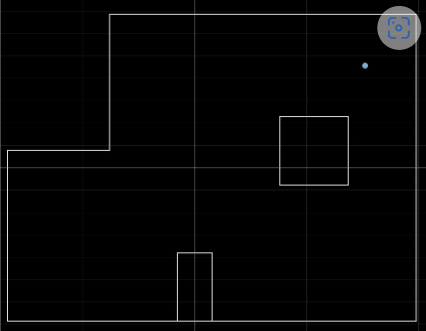
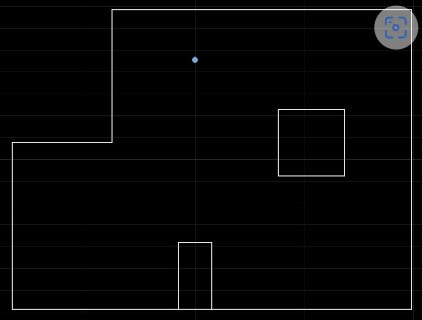
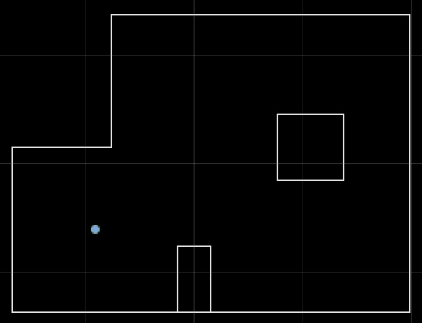
Testing Localization in Simulation
To check that everything was set up properly, I first ran the provided notebook lab11_sim.ipynb, which is an optimized Bayes
filter implementation for the simulated robot. The map used (dimensions: x=12, y=9, theta=18 ) was divided into a 3D grid size
of 1944 possible robot poses. Pictured is a screenshot of the localization in simulation.
Testing Localization in Real Life
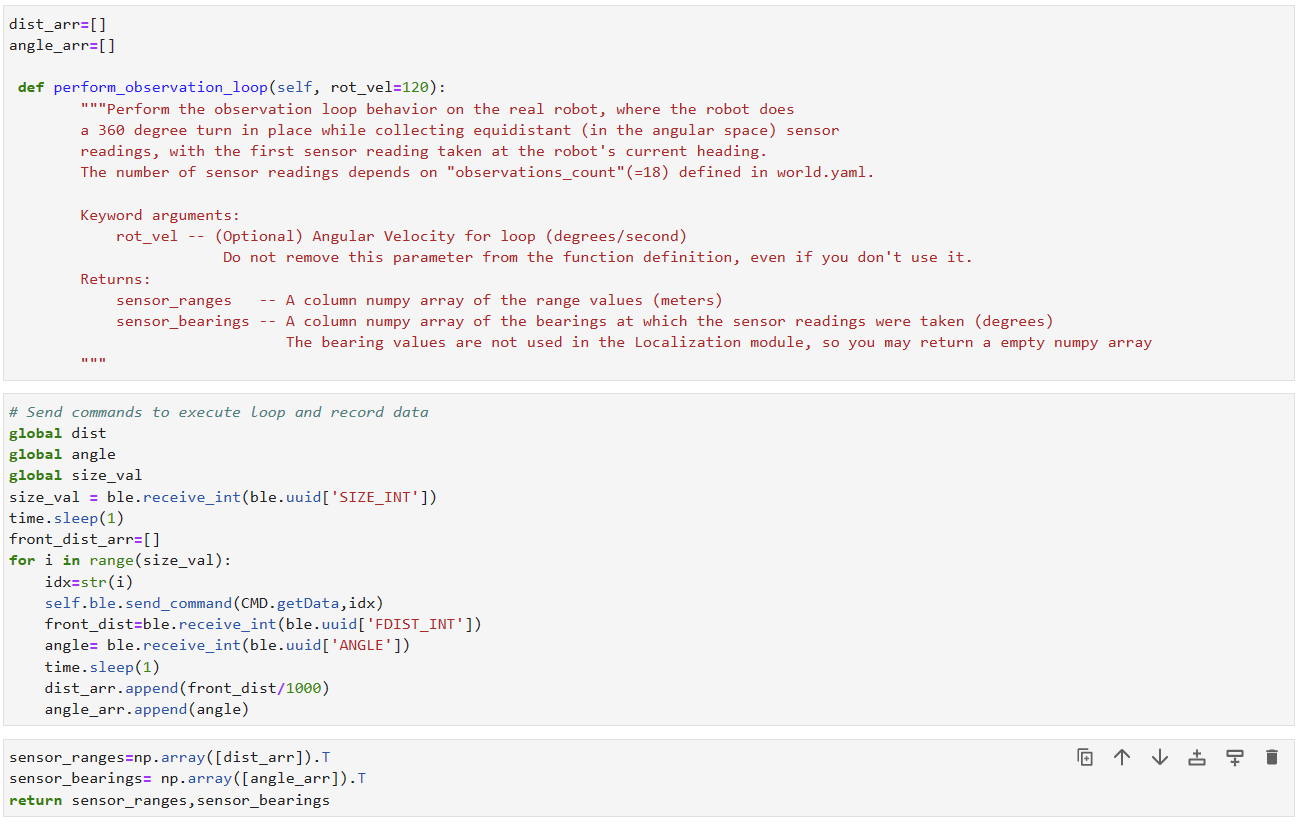
Next, to implement the localization algorithm on the physical robot, I ran lab11_real.ipynb and implemented the perform_observation_loop
member function of the class RealRobot using the localization code from lab 9. However, some adjustments were made to ensure
compatibility with the provided localization code, namely modifying the format of my data a slight bit to represent my vector
as a numpy array. The method should output this array where it consists of 18 ToF sensor readings and the respective angle at
20-degree increments from 0 degrees to 340 degrees. Since the robot goes counterclockwise, this array was also inverted.
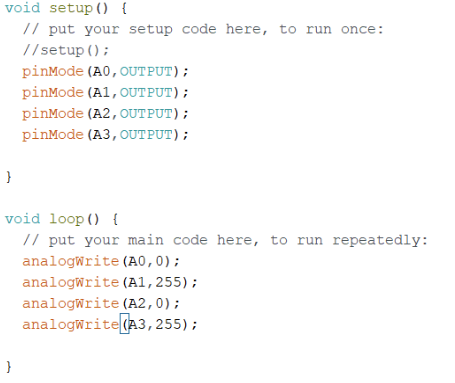
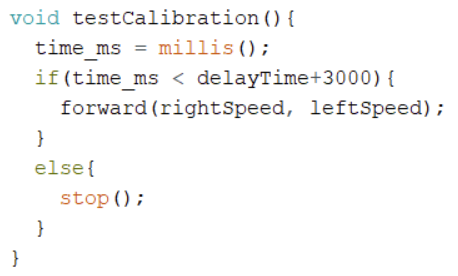
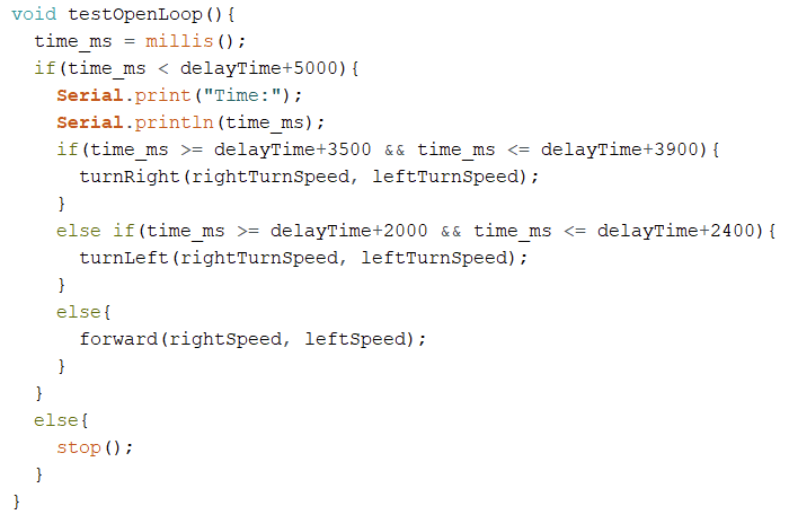
Arduino Code
Pictured below is the Arduino code used.
Python Code
Picutred is the Python code used.
Results
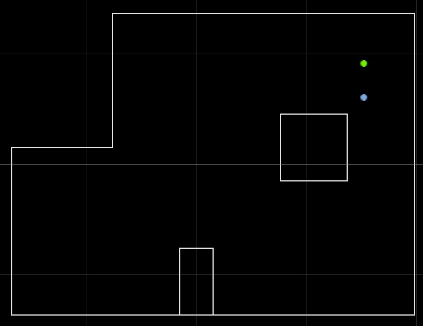
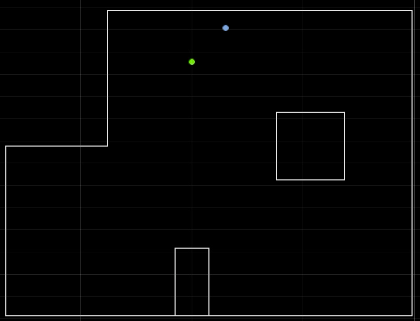
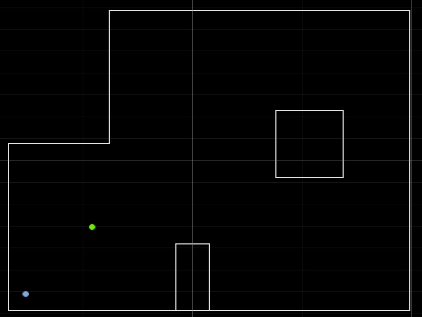
I tested the following locations two times. Plotted for each test are the belief (the blue dot) and the ground truth (the green dot):
(5,3)
The first test for this spot turned out to be accurate with the program correctly predicting the robot’s position. As seen, the
ground truth is directly above the initial belief. However, for the second test, the initial belief was one grid below from the
ground truth.
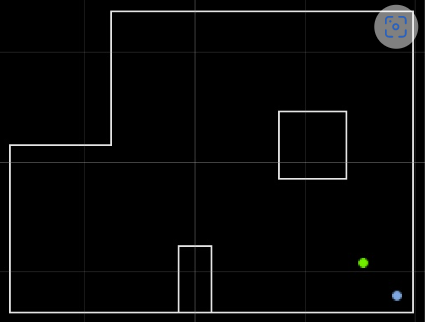
(5,-3)
Both tests for this location turned out to be slightly off. For the first test, the initial belief is one grid down and one grid
to the right from the ground truth. For the second test, the initial belief is also one grid down but this time it is also one grid
to the left of the ground truth.
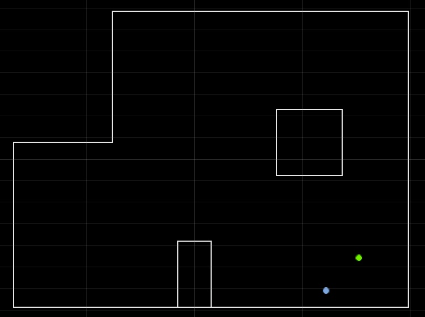
(0,3)
The first test for this spot turned out to be accurate with the initial belief matching the ground truth. However, for the second test,
the initial belief is one grid above and one grid to the right from the ground truth.
(-3,-2)
For this spot, the initial belief matched the ground truth for the first test. However, it was two grids below and two grids to the left
from the ground truth.
Discussion:
Overall, it seems that the localization performs reasonably well. The first tests for most of the locations were accurate while all of the
second tests were slightly off. A reason for this could be the limited range of ToF sensor. The farther away objects are, the less accurate
the sensor will be. The inaccuracies could also be related to the symmetry of the surroundings and how the localization algorithm seems to be
less accurate the more symmetrical a location is.
Objective
The goal of Lab 12 is to have the robot navigate through a set of waypoints in that environment as quickly and accurately
as possible.
Hardware
1 x Fully assembled robot, with Artemis, TOF sensors, and an IMU.
Software
Arduino IDE
0. Note on Robot Issues
During the Robotics showcase, my robot started overheating and smoking. After the TAs and I detached the motor battery, we
found that the motor battery wires fused together and that one of the motor drivers was damaged to the point where it was no
longer usable. After consulting the TAs and Kirsten, it was determined that the best steps for me moving forward were to
borrow other people’s robots and collaborate with them to get the labs finished.
Example4_Serial
I uploaded code from File->Examples->Artemis Examples->Example4_Serial to test the serial communication between the Artemis
board and the computer, which was shown in the serial monitor. It also allowed the user to provide an input, which would then
be echoed back as the output.
Example2_AnalogRead
To test the temperature sensor, I uploaded code from “File->Examples->Artemis Examples->Example2_analogRead”. In the video,
whenever my thumb wasn’t on the chip, the temperature values were in the 4000s range. Whenever my thumb pressed on the chip,
the readings shot up into the 20000s range.
Gratitude
I would like to thank